
Case Study · Live, but moving slowly
$154K GMV in one month: US health and wellness brand case study
A US health and wellness brand that closed August 2026 at $154,513 in GMV and 3,374 orders, up 145 percent on July, with the final week running 47 percent above the week before it.
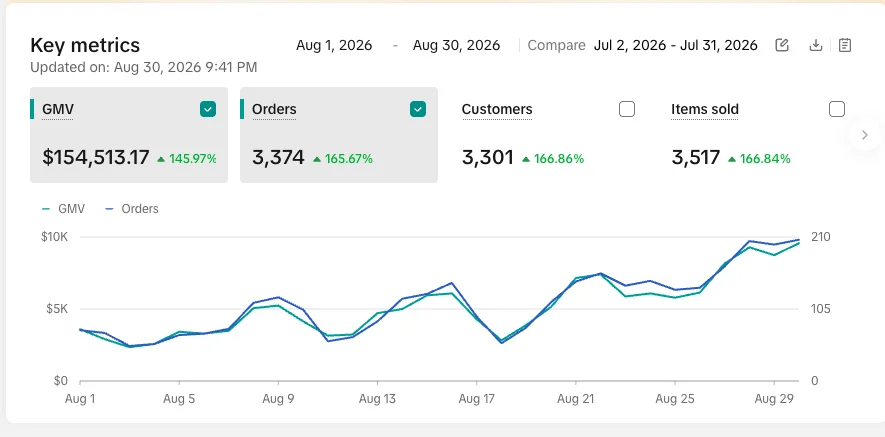
TikTok Shop Seller Center dashboard for a US brand, pulled on August 30, 2026 and untouched. Figures in USD. The brand name is shared on the call. Results are from a specific client campaign, vary by brand, and are not guaranteed.
The starting point
A US health and wellness brand that was already live on TikTok Shop with a working product and a clear customer, but with the shop moving slowly. The July comparison window on the dashboard puts the month before at roughly $62,800 in GMV. The engine that turns a live shop into a compounding one, creators posting at volume, samples tracked, ads on proven content, was not yet running.
What we did
- Recruited creators 1 by 1 for this product. Personal outreach instead of blast messages, every applicant vetted for niche fit and posting consistency before a single sample shipped.
- Tracked every sample as a line item. Units out, videos back, and follow up until the video posted, so seeding stayed a system instead of a giveaway.
- Coached the content daily. Hooks, angles, and reference videos handed to creators up front, with feedback on every video so the average kept rising instead of the best one carrying the month.
- Ran GMV Max on proven videos only. Ads went behind the creator content that was already selling organically, with 3 to 4 day stabilization windows and budget raised 20 to 30 percent at a time as the return held.
The results
- $154,513.17 GMV in August 2026, up 145.97 percent on the July window
- 3,374 orders, up 165.67 percent, from 3,301 customers and 3,517 items sold
- $53,757.25 in the final 7 days (August 24 to 30), up 46.97 percent on the week before, across 1,191 orders
- Daily GMV roughly tripled inside the month, from about $3,000 a day in the 1st week to about $9,500 a day by the last
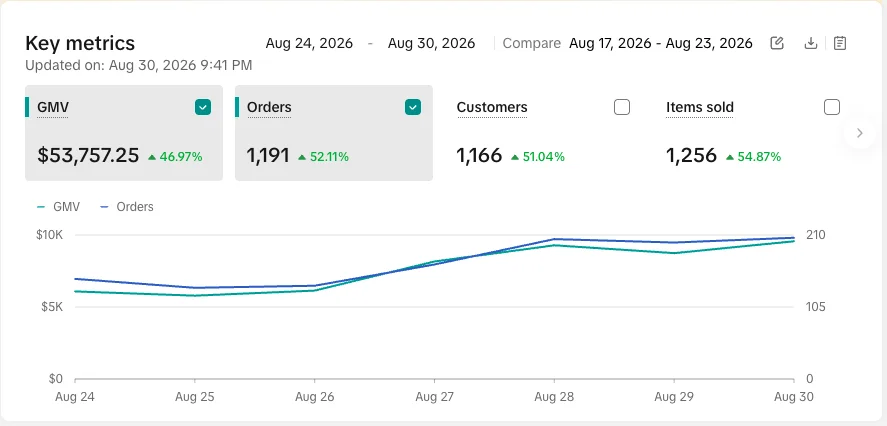
The final week of the month, pulled the same evening. Every line moved up 46 to 55 percent on the week before.
Why it worked
The shape of the chart is the story. There was no single viral spike, just a line that stepped up every few days as more creators posted, more of their videos got ad budget, and the algorithm read a shop with rising sales history. That is what a creator engine looks like when it compounds, and it is why the last week of the month did more than a third of the month's revenue on its own. The shop entered September already accelerating, which is exactly the position we want a brand in before Q4. The full system behind this case is on our strategy page, the ad discipline is in our GMV Max budget guide, and the Q4 plan it feeds into is in our Q4 playbook.
This is a single month on a shop that was already doing about $62,800 a month, so it shows a live shop accelerating, not a launch from zero.
Want results like this for your brand?
Book a strategy call. We will look at your product, your margins, and your category, and tell you exactly what we would do in the first 30 days.
Book a call →