
Case Study · Steady months, not spikes
$260K GMV in 5 months: how Gyal Braids stopped spiking and started compounding
Gyal Braids, a US hair brand, did $260,000 in GMV and 5,441 orders between January 1 and June 1, 2026, up 120.8 percent on the previous 5 months, with daily sales holding in a steady band for 150 days instead of living off one viral week.
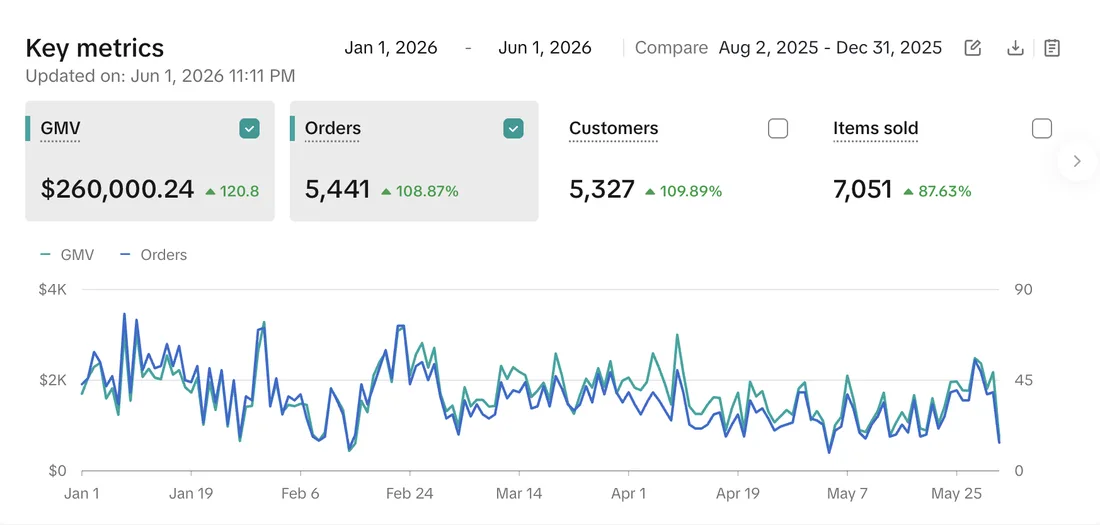
TikTok Shop Seller Center dashboard, January 1 to June 1, 2026, untouched. Figures in USD. Comparison column is August 2 to December 31, 2025. Results are from a specific client campaign, vary by brand, and are not guaranteed.
The starting point
Gyal Braids had a shop that had proven it could sell, but it sold in bursts. A good creator video would spike the chart for a few days and then the line would fall back. The comparison window on the dashboard, August through December 2025, holds the before picture: less than half the GMV of the 5 months that followed, on a chart that lived and died by its spikes.
What we did
- Replaced spikes with cadence. Built a creator community that posts every week, so the shop stopped depending on any single video landing.
- Tracked samples as line items. Every unit out, every video back, with daily follow up until the content posted, which keeps posting rates high instead of hoping.
- Kept the content angles rotating. New hooks and formats briefed every week so the feed never fatigued on one look, and so winners kept surfacing for ads to amplify.
- Layered GMV Max on proven videos. Ads spent behind content that was already converting, scaled 20 to 30 percent at a time, which is what turned a steady organic baseline into a steady paid one.
The results
- $260,000.24 in GMV between January 1 and June 1, 2026, up 120.8 percent on the previous 5 months
- 5,441 orders, up 108.87 percent, from 5,327 customers, up 109.89 percent
- 7,051 items sold, up 87.63 percent
- 150 days of consistent daily sales, most of them between roughly $1,000 and $3,500 a day, with no single day carrying the result
Why it worked
Consistency is the least glamorous number on a dashboard and the most valuable one, because it is the only kind of revenue you can plan inventory, cash flow, and ad budget around. A shop that does $2,000 a day for 150 days has a business. A shop that does $30,000 in one viral week and $200 a day after it has a story. The chart on this page is the first kind, and it came from creator volume plus weekly angle rotation, not from chasing another spike. The system is on our strategy page, the creator engine behind it is our affiliate and creator program, and the way we keep content from fatiguing is in what content sells on TikTok Shop.
This shop was already selling before the window opened, so the 120.8 percent is growth on an existing base, not a launch from zero.
Want results like this for your brand?
Book a strategy call. We will look at your product, your margins, and your category, and tell you exactly what we would do in the first 30 days.
Book a call →